Logs
Welcome to the Audit Logs Guide for employers on HST Sira!
The Audit Logs section allows you to monitor and track all system activities. This provides comprehensive visibility into platform usage and security events.
- Navigate to Logs.
 In this section, you can see audit logs lists, total count cards,export button, and filters
Dashboard Overview
Key Metrics Display:
Total Logs
- Total number of log entries in the system
- Represents all recorded activities and events
Successful
- Number of successfully completed actions
- Tracks operations that completed without errors
Failed
- Number of failed or errored actions
- Monitors system errors and unsuccessful operations
Active Users
- Number of currently active users
- Shows real-time platform usage
Exporting Logs
Export Options:
- Export page (10) - Export current page of logs
- EXPORT SELECTED (1) - Export specific selected logs
- Control the number of records to export
Filtering Logs
Available Filters:
Date Range
- Filter logs by specific time periods
- Custom date range selection available
Status
- All Statuses - View all log entries
- Filter by Success, Failed, or other status types
Action
- All Actions - View all activity types
- Filter by specific action categories
Applying Filters:
- Set your desired filter criteria
- Click "Apply Filters" to update the log view
- Use "Reset Filters" to clear all filters and return to default view
Logs Table Structure
Column Headers:
| Column | Description |
|---|---|
| Timestamp | Date and time when the action occurred |
| User | User who performed the action (e.g., "anonymous") |
| Date | Date of the action |
| Action | Type of action performed (e.g., "Recorder") |
| Service | System service involved (e.g., "ENSG/ITE") |
| Target | Specific target or function (e.g., "MoveVettingRequests...") |
| Status | Action outcome (e.g., "Secure", "Success") |
| IP Address | User's IP address (e.g., "::ffff:156.159.236.45") |
| Actions | Available operations (e.g., "👁️" view details) |
Viewing Log Details
- Navigate to Logs -> on the Individual list of log click Eye Icon(👁️).

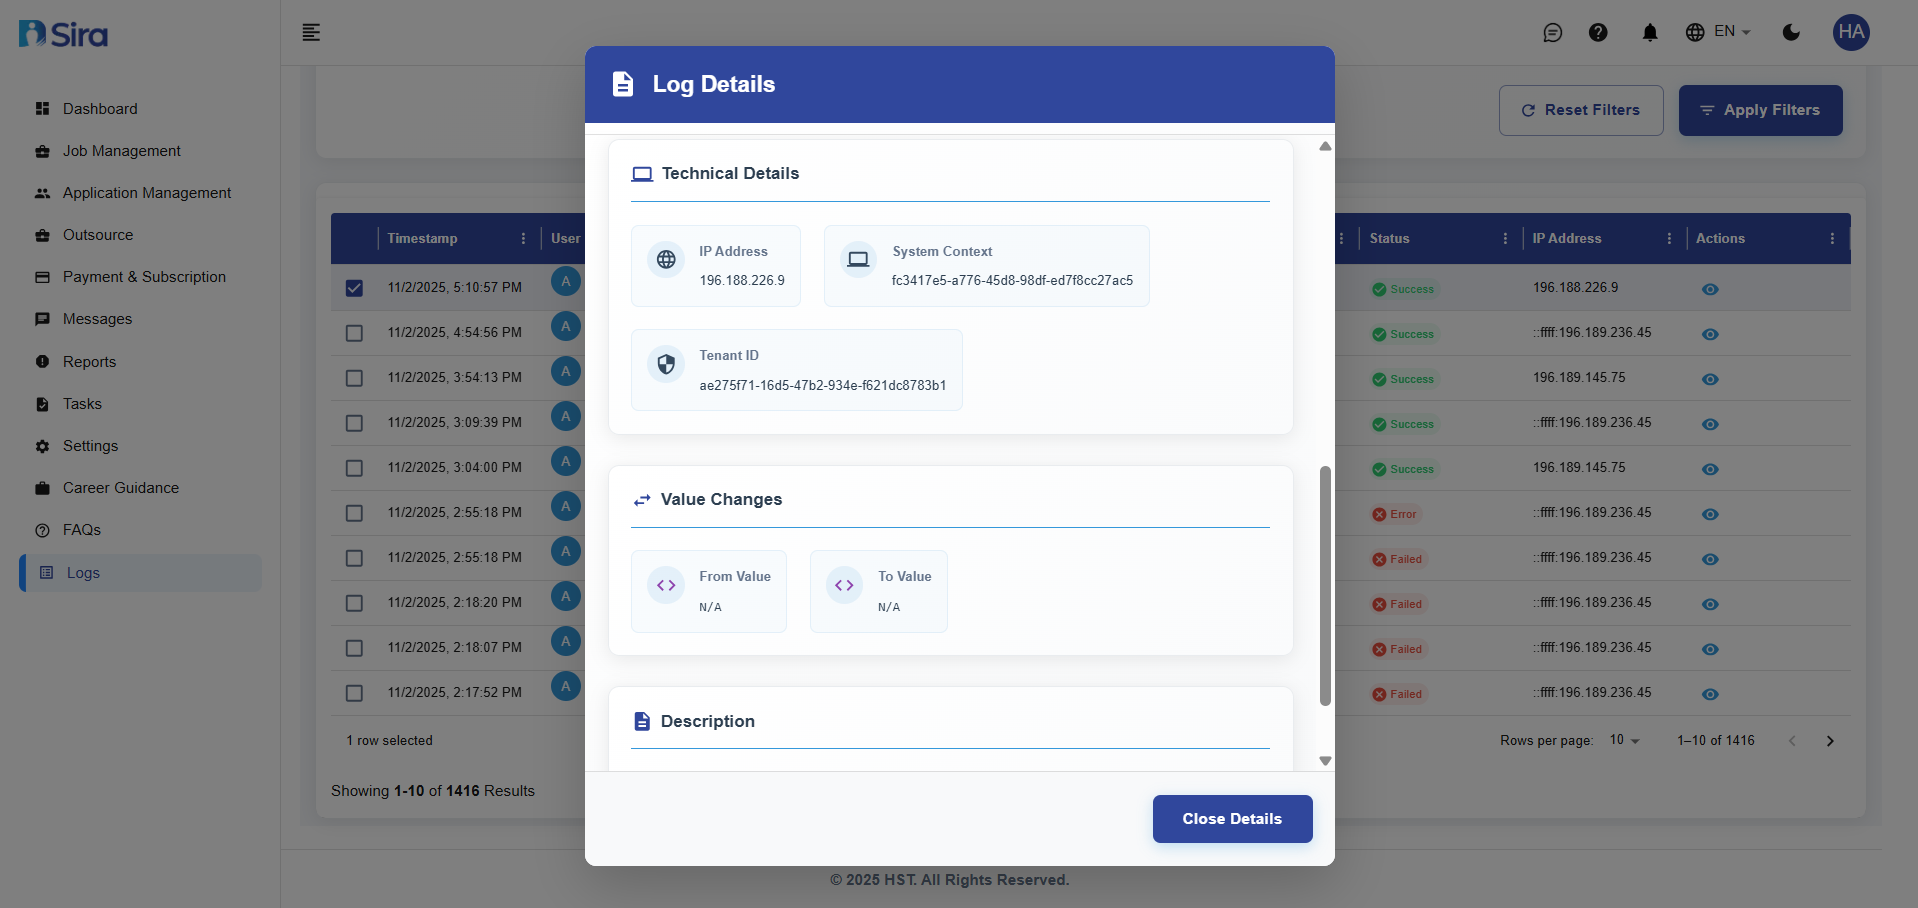 In this section, you can see detail of the log
Detailed Log Information:
Basic Information
- Timestamp: Exact date and time of the action
- Status: Overall success/failure status of the action
User Information
- User Name: Name of the user who performed the action
- User ID: Unique identifier for the user
- User Role: User's role in the system (e.g., "Employer")
Action Details
- Comprehensive breakdown of the performed action
- Service and component information
- Specific function or method called
Technical Details Section
- IP Address: Detailed IP information (e.g., "195.199.52.94")
- System Context: System identifier (e.g., "c3417e6-a77e-6d8-96df-ac7f9ec27a65")
- Tenant ID: Tenant identification (e.g., "Unknown")
Value Changes Section
- From Value: Previous value before change
- To Value: New value after change
- Tracks data modifications and updates
Description Section
- Provides contextual information about the logged event
Best Practices
Monitoring:
- Regular Review - Check logs periodically for unusual activity
- Filter Effectively - Use filters to focus on relevant events
- Export for Analysis - Export logs for detailed investigation
- Track Patterns - Look for patterns in user behavior and system usage
Troubleshooting
Common Issues:
No Logs Displayed
- Issue: Log table appears empty
- Solution: Check filter settings or contact administrator
Missing Details
- Issue: Limited information in log entries
- Solution: Click eye icon for full details
Export Problems
- Issue: Cannot export logs
- Solution: Verify selection and try different export options
Filter Not Working
- Issue: Filters don't change displayed results
- Solution: Reset filters and reapply with different criteria
Need Assistance?
- Contact customer support
- Refer to FAQs section for common questions
- Contact system admin for technical issues